What Your Incident History Is Actually Telling You
Aug 13, 2026 · 2 min read
A single incident tells you less than a pattern of them
One outage is an event. Three outages with the same cause, a week apart, are a pattern — and the pattern is usually the more useful thing to notice.
What's actually recorded
Each incident logs when it started, when it recovered, how long it lasted, and the specific cause: a timeout, a connection refused, a DNS failure, a TLS certificate problem, or an unexpected status code. That last distinction matters more than it looks — a timeout points at your server being overloaded or slow; a DNS failure points at your domain configuration or registrar, not your application at all; a certificate problem is a renewal that didn't happen, not a code issue.
Patterns worth watching for
Same cause, recurring — three timeouts in a month, all around the same time of day, usually means a resource constraint (a cron job, a backup, a traffic spike) rather than three unrelated incidents.
Duration creeping up — if outages are getting longer even though they're not more frequent, whatever's causing them is probably getting harder to recover from automatically, which is worth investigating before it becomes a much longer one.
Clustering right after a deploy — an incident that starts within minutes of a known deployment is a strong hint about where to look first, even if the monitor itself has no idea a deploy happened.
Where to look
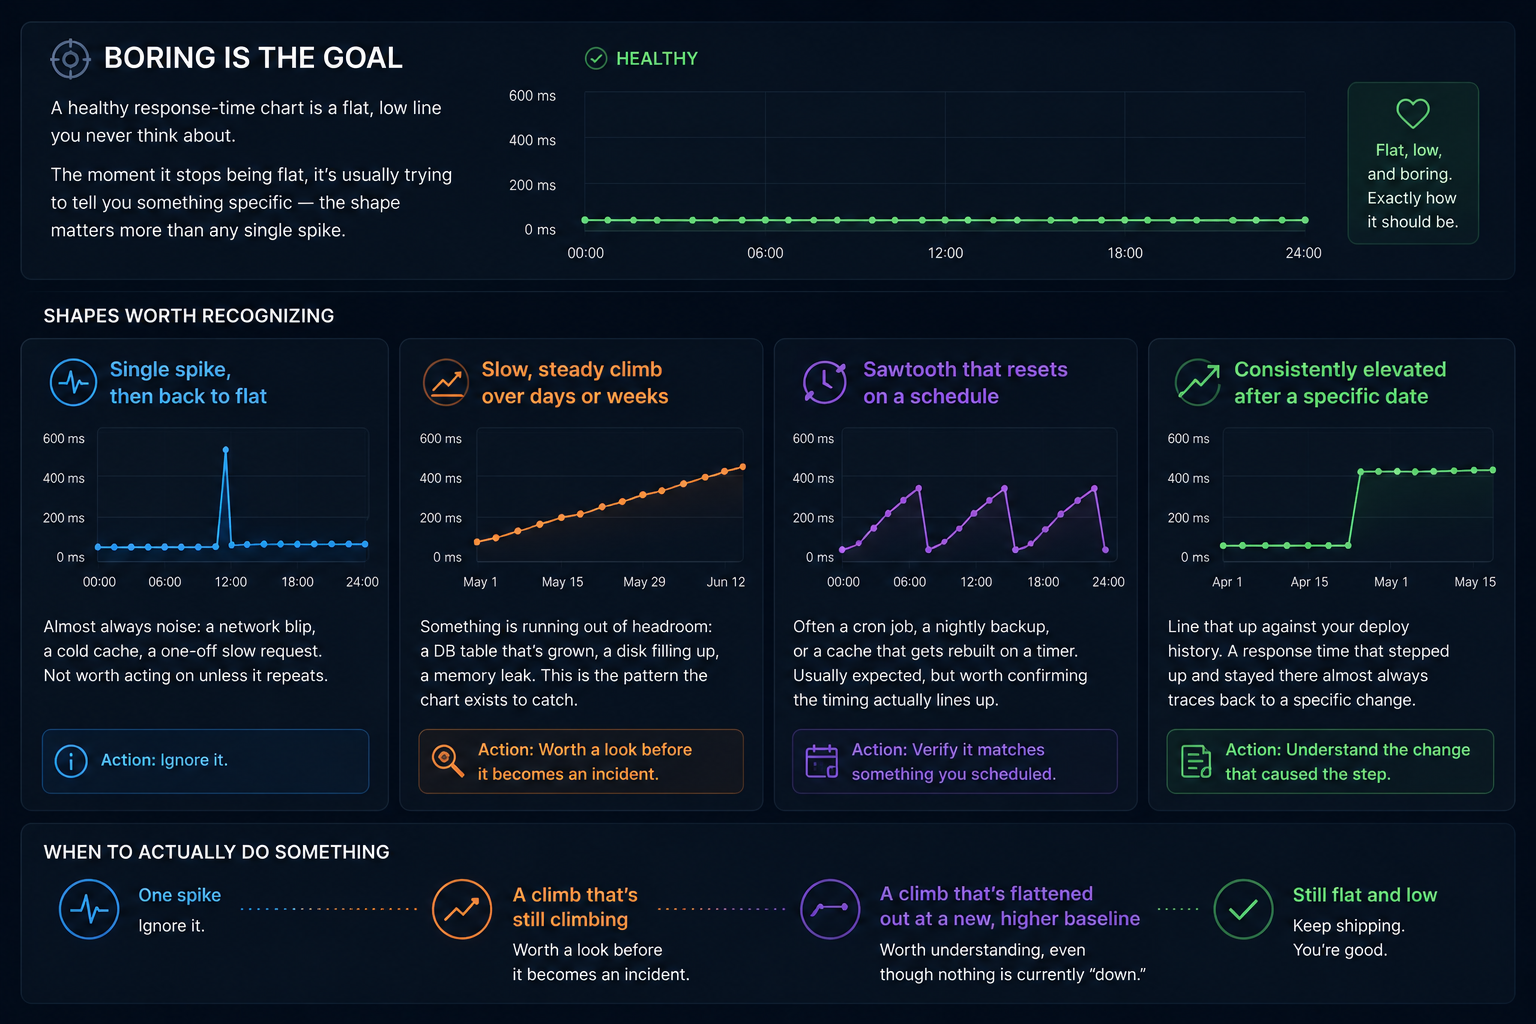
The dashboard shows response-time trends alongside the incident log for exactly this reason: a site that's slowly getting slower for weeks before it finally times out was visible in the charts long before it showed up as an outage. The incident log tells you something broke; the response-time trend often tells you it was going to.